PRODUCT · UGC TRACKING

Where the culturemoves first.

UGC tracking for music: TikTok and Instagram song-level video counts on every artist’s top 10 tracks. Daily growth, change rates, and pattern-break alerts.

Song page
A song page: Spotify streams, TikTok and Instagram UGC, daily chart and Listen on Spotify
Live product Song-level TikTok and Instagram video counts next to Spotify streams. Artist names shown are fictional.
Who it is for

Anyone who needs to see which song is actually working.

Marketers, managers, A&R, supervisors. The people whose decisions hinge on whether a song is being used by real listeners or whether it’s a stat in a spreadsheet.

The problem

Stream counts lag what creators are doing.

A song that is going to break shows up in UGC first. Creators use it, the audio page fills, the count climbs. Streams catch up two to four weeks later. Watching streams alone means you’re always behind.

The head start
109days

15 artists signed after we flagged them. On average they were on the dashboard 109 days before the deal.
See the Record →

281
Unsigned artists tracked
18
Added this week
19
Countries

US 156·UK 43·Canada 13·France 13·Australia 12·+14 more

Live · updated every morning

Inside the product

See which songs fans are actually using.

01 · MOVERS

The songs gaining videos right now.

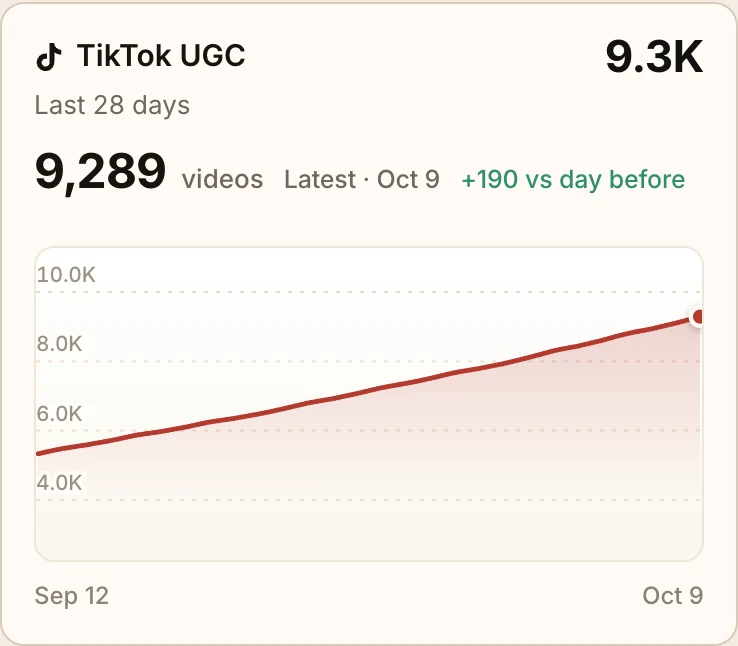
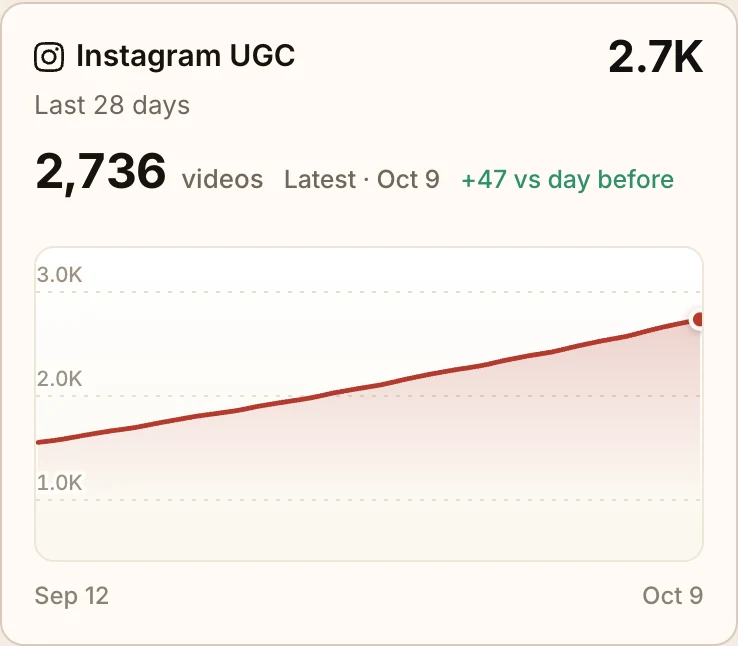
Movers ranks songs by how fast TikTok and Instagram videos are growing, so you see what is catching on before streams follow.
  • Daily UGC growth by song
  • TikTok and Instagram counted separately
  • Built for phone and desktop
TikTok
TikTok videos using the song, last 28 days
Instagram
Instagram videos using the song, last 28 days
02 · ALERTS

Told the day it spikes.

UGC spikes land on your dashboard and in your inbox with the song behind them.

  • Every alert names the song
  • Sustained momentum, not one-day noise
  • Dashboard and email
Alerts
Alerts on the desktop dashboard
The same alert on a phone
What it tracks

The signals that matter.

01
Daily video counts
TikTok and Instagram. Per song, per artist, every day.
02
Growth rate
Day-over-day and week-over-week. Filter for acceleration.
03
Pattern breaks
Spikes that beat the artist’s own baseline. Auto-flagged.
04
Top 10 tracking
The artist’s 10 most-streamed songs, plus every new release.
05
Cross-platform
TikTok and Instagram side by side. Spot which platform is leading.
06
Multi-day trend
Sustained climb vs. one-off virality. Built into the chart.
Sample signal report

Here is what early looks like.

Jerri’s "Loop" went from 2.3K TikTok videos to 140K in 82 days. The chart showed the curve before the streams confirmed it.

Jerri
Jerri
Hit our radar Jan 28, 2026 · 82-day window · Independent
Loop streams
2K9.6M
Monthly listeners
254K764K
TikTok UGC
2.3K140K
Instagram UGC
75218K
For anyone who needs to know what is breaking before it breaks, this is the read. UGC leads. Streams confirm. A&R teams use it as one input in the A&R discovery workflow.

See it for yourself.

Start a 3-day trial and see what BTD surfaces this week. Or join the free newsletter and read along first.

Other product pages